

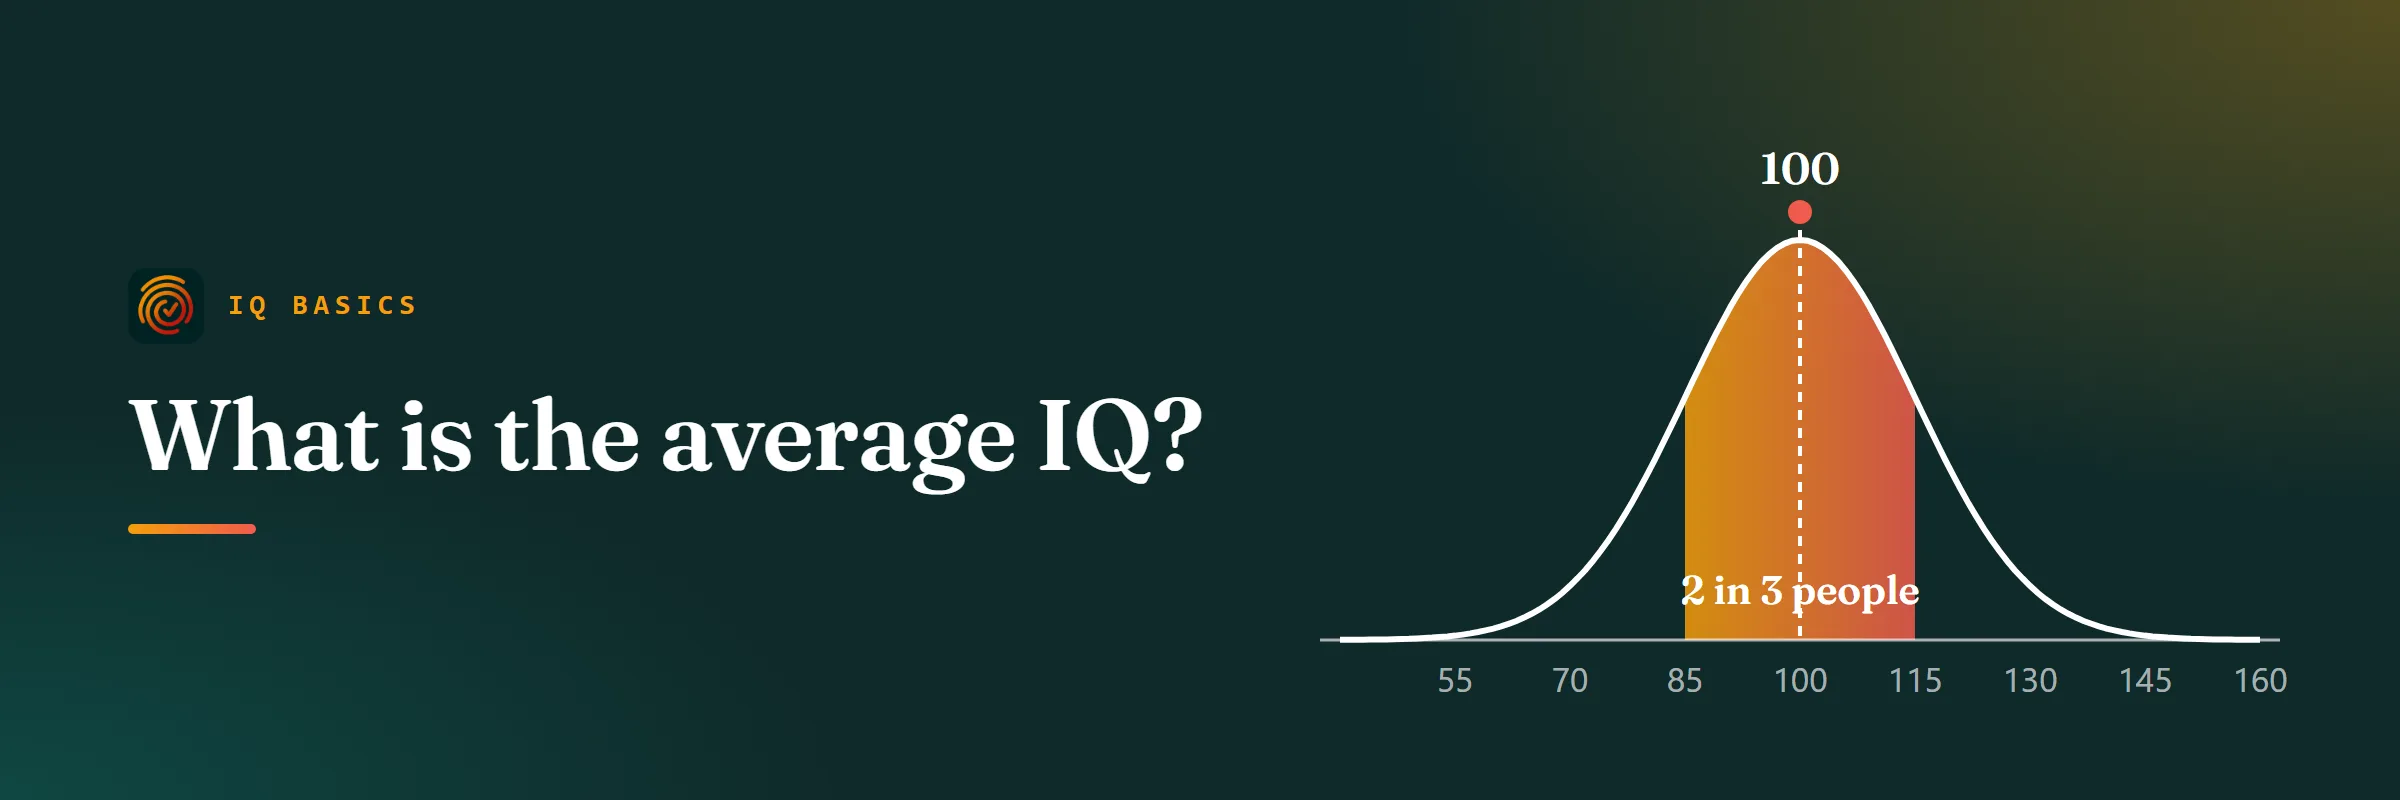
An IQ score is not a raw count of right answers. It shows where a person stands compared with other people of the same age, on a scale whose middle is set at 100. So the mean is 100 by design, and the more useful questions are how wide the typical band is, how the middle is kept at 100, and what a score near 100 does and does not tell you.
Why the average IQ is always 100
Modern IQ tests use what psychologists call a deviation IQ. When a test is built, its makers give it to a large sample chosen to match the population by age, sex, region and education. They then convert raw scores so that the middle of each age group lands on 100 and each standard deviation is worth 15 points. David Wechsler introduced this method in 1939, and tests such as the WAIS, the WISC and the Stanford-Binet use it today.
Because the scale is fixed this way, a score describes rank, not an amount of intelligence. An IQ of 100 means "about half of people your age score lower". The middle cannot drift over time on a given test, because test makers renorm their tests every decade or two to keep the middle at 100.
The bell curve above shows how scores spread across the IQ range. About 68% of people score between 85 and 115, about 95% between 70 and 130, and only about 2% score above 130 or below 70.
What counts as an average IQ score
Score labels come from the Wechsler scales. The Average range runs from 90 to 109 and holds about half of the population. Below it sit Low Average (80 to 89) and Borderline (70 to 79); above it sit High Average (110 to 119), Superior (120 to 129) and Very Superior (130 and above).
| Score | Range name | Percentile | % of people |
|---|---|---|---|
| 130 and above | Very Superior | 98th and above | 2.3% |
| 120 to 129 | Superior | 91st to 98th | 6.8% |
| 110 to 119 | High Average | 75th to 91st | 16.1% |
| 90 to 109 | Average | 25th to 75th | 49.5% |
| 80 to 89 | Low Average | 9th to 25th | 16.1% |
| 70 to 79 | Borderline | 2nd to 9th | 6.8% |
| 69 and below | Extremely Low | 2nd and below | 2.3% |
The labels are conventions, not hard lines. A 109 and a 111 reflect almost the same performance, and every measured score carries a margin of error of several points.
How IQ is measured
A clinical IQ comes from an individually given test, scored against the norms described above. The most widely used are:
- Wechsler Adult Intelligence Scale (WAIS), for adults, now in its fifth edition.
- Wechsler Intelligence Scale for Children (WISC-V), for ages 6 to 16.
- Stanford-Binet Intelligence Scales, Fifth Edition, for ages 2 to adult.
- Raven's Progressive Matrices, a non-verbal test of pattern reasoning, often used where language would get in the way.
The Wechsler tests combine several subtests, such as vocabulary, block design, matrix reasoning, digit span and symbol coding, into index scores for verbal comprehension, perceptual reasoning, working memory and processing speed. Those combine into the full-scale IQ. A trained examiner gives the test one to one, which is why a clinical result is more precise than any online test.
Online tests, including ours, give an estimate. Ours uses four kinds of reasoning puzzle and shows a 90% range next to the score, so you can see how much weight the number can carry.
What IQ tests are used for
Most IQ tests are given for a practical reason rather than curiosity. Schools and educational psychologists use them to understand learning difficulties and to identify children for gifted programmes. Clinicians use them as one part of diagnosing an intellectual disability, which also requires real difficulties with everyday adaptive skills, not a low score alone. Neuropsychologists use them to track thinking after a brain injury or illness, and researchers use them to study how ability develops.
Some employers use shorter reasoning tests in hiring. Those are related to IQ tests but are not the same thing, and an online score should never be used for decisions about a person's education, health or job.
Average IQ by age
The average IQ is 100 at every age, because each age group is scored only against people of the same age. A 10-year-old with an IQ of 100 and a 40-year-old with an IQ of 100 both sit exactly in the middle for their age, even though the adult can solve far harder problems.
What does change with age is raw ability. Reasoning on new problems, sometimes called fluid intelligence, rises fast through childhood and peaks in early adulthood. Knowledge and vocabulary, called crystallised intelligence, keep growing well into middle age. In later life, speed of processing usually slows first, while knowledge holds up longer. IQ scores themselves become more stable after childhood, so a score measured at age 7 predicts adult IQ less well than one measured at 17.
Average IQ in the United States and around the world
On tests normed on the US population, the US mean is 100 by definition; the same holds for the UK on UK-normed tests. Comparing countries needs one test given the same way to fair samples in every country, and that is rarely done.
The country rankings that circulate online mostly trace back to datasets compiled by Richard Lynn and colleagues. Researchers have criticised those datasets for small or unrepresentative samples, mixed tests and estimated values for countries with little or no data. Differences in schooling, nutrition, health and test familiarity also move national results. For those reasons we do not publish a country ranking: the numbers look precise, but the method behind them is not.
Is the average IQ rising? The Flynn effect
In the 1980s the researcher James Flynn showed that raw scores on IQ tests had risen across many countries, by about three IQ points per decade. This rise is called the Flynn effect. It means that a person scored against old norms looks better than the same person scored against new ones, which is one reason tests are renormed.
| If the test norms are… | Typical score inflation at about 3 points per decade |
|---|---|
| 10 years old | about 3 points |
| 20 years old | about 6 points |
| 30 years old | about 9 points |
The table illustrates the typical rate, not a correction to apply to any one score. The causes are still debated; better nutrition, more schooling, smaller families and a world full of abstract symbols are leading explanations. Since the 1990s, some countries have recorded a slowdown or a small reversal: a large study of Norwegian men born after 1975 found falling scores, and the pattern held within families, which points to environmental causes rather than changes in who has children.
How to read a single score
No test measures anyone exactly. Clinical tests report a confidence interval, typically several points either side of the score, because a person tested again on a different day would rarely get the identical number. A result of 104 is best read as "somewhere around the middle of the range", not as proof of being above the mean.
Online tests have wider margins still, because nobody supervises the conditions and the norms are less exact. That is why our free test reports a 90% range next to every estimate, and why we suggest reading the range name, such as Average or High Average, rather than the exact number.
What shapes an individual IQ
Both genes and environment matter, and they work together. Twin and adoption studies estimate that the heritability of IQ is moderate in childhood and higher in adulthood. Heritability describes how much of the variation within a group links to genetic differences; it does not mean an individual's score is fixed.
On the environmental side, schooling has a measurable effect on IQ, and so do early nutrition, health, and exposure to lead and other toxins. Test-day factors such as sleep, stress, illness and familiarity with the question types can move a single result by several points.
What an average IQ means for school, work and life
IQ is one of the better single predictors of school grades: in research summaries, the correlation is around 0.5, which is strong for a psychological measure but leaves most of the variation to other things. It also predicts performance in complex jobs, though recent studies find a smaller link than older ones did.
A score near 100 is fully compatible with success in education and almost any career. Effort, interest, knowledge, health, social skills and opportunity all shape outcomes, and none of them shows up in an IQ score.
IQ is not the only way to describe intelligence
IQ tests measure a broad reasoning ability that psychologists call general intelligence, or g: people who do well on one kind of mental test tend to do well on others. That finding is one of the most replicated in psychology, but it is not the whole picture.
Howard Gardner's theory of multiple intelligences proposed separate abilities such as musical, interpersonal and bodily skill; it is popular in schools but has little support from testing research. Robert Sternberg's model adds creative and practical intelligence alongside analytical skill, and research on emotional intelligence looks at how people perceive and manage emotions. Each describes something real about people that a standard IQ score leaves out.
What the average cannot tell you
- It does not measure creativity, practical judgement, emotional understanding or persistence.
- It does not describe any one person: a group mean says nothing about where a given individual stands.
- It is not a fixed trait for life: scores in childhood can move noticeably, and adult scores still vary by a few points between sittings.
- It cannot be read across tests without care: different tests and different norm years can give scores several points apart.
Where to get an IQ test
For an official result, a licensed psychologist gives an individual test such as the WAIS or WISC, usually as part of a wider assessment; for children, schools can often arrange this through an educational psychologist. Costs and waiting times vary a lot by country and provider.
For a quick, free estimate, our 32-puzzle IQ test takes about 25 minutes, needs no email and shows your result with a likely range.
A short history of the IQ average
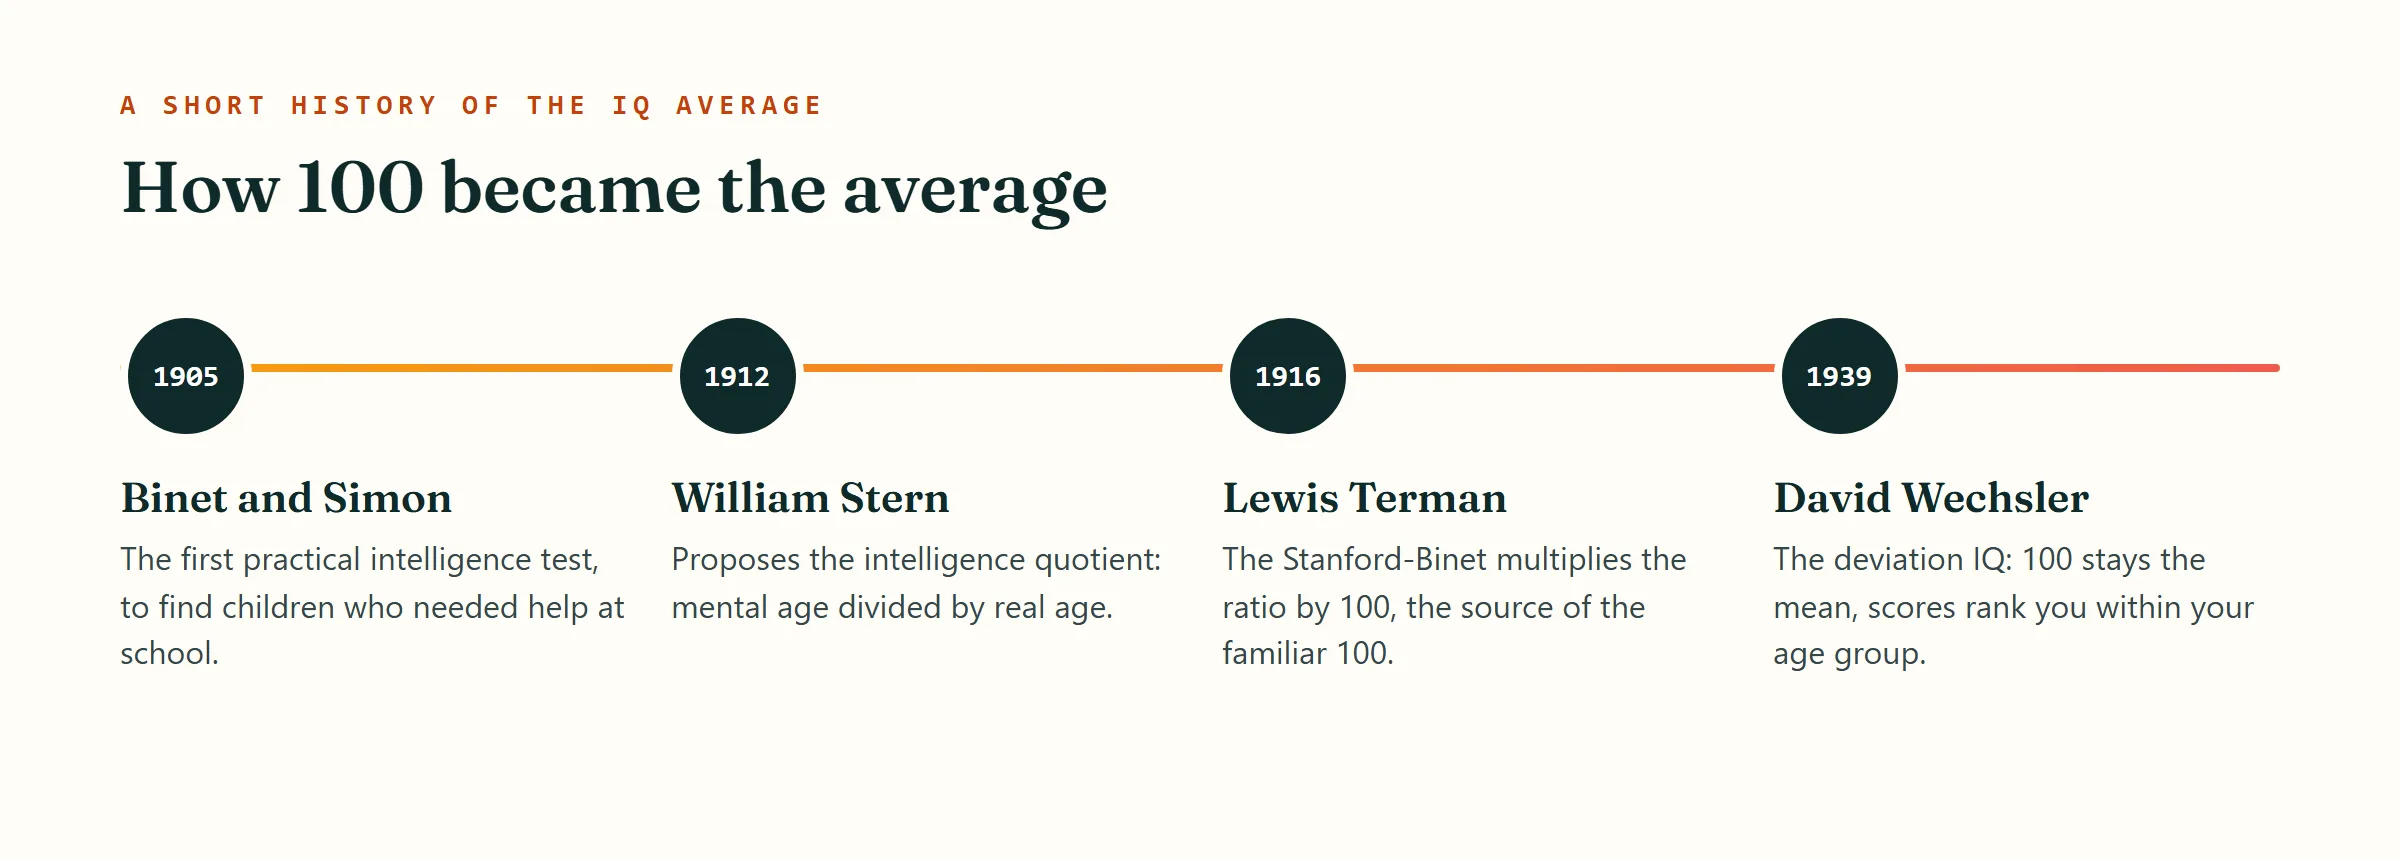
In 1905 Alfred Binet and Théodore Simon in France published the first practical intelligence test, built to find children who needed extra help at school. In 1912 the German psychologist William Stern proposed the intelligence quotient: mental age divided by real age. Lewis Terman's 1916 Stanford-Binet multiplied that ratio by 100, which is where the familiar 100 comes from. In 1939 David Wechsler replaced the ratio with the deviation IQ, keeping 100 as the mean but basing scores on rank within an age group, the system still used today.
Frequently asked questions
Is 100 a good IQ score?
An IQ of 100 is exactly average: half of people score higher and half score lower. It sits in the middle of the Average range, which runs from 90 to 109 and covers about half of the population.
What IQ is above average?
Any score above 100 is above the mean, but the Average range runs from 90 to 109. Scores from 110 to 119 are called High Average, and from 120 upward the labels are Superior and Very Superior.
What percentage of people have an IQ above 130?
About 2.3%, or roughly 1 in 44 people. Two standard deviations above the mean, 130 is the usual cut-off for Mensa and for many gifted programmes.
What is the average IQ in the United States?
On tests normed on the US population, such as the WAIS and the WISC, the US average is 100 by definition. Published country rankings that put the US slightly lower come from older datasets whose methods are widely disputed.
Is the average IQ going up or down?
Raw scores rose by about three IQ points per decade through much of the twentieth century, which is why tests are renormed. Some countries, including Norway, have since recorded small declines in younger groups.
Does the average IQ change with age?
No. Each age group is compared with people of the same age, so the average is 100 at every age. What changes is raw reasoning ability, which rises through childhood and shifts again in later life.
Is there a difference in average IQ between men and women?
On modern tests the overall averages of men and women are very close. Test makers check their items so that neither group is favoured overall.
How can I find out my own IQ?
A clinical IQ comes from a psychologist using a test such as the WAIS. For an estimate, you can take our free 32-puzzle test, which shows your score with a likely range.
Sources
- Neisser, U., et al. (1996). Intelligence: Knowns and unknowns. American Psychologist, 51(2), 77-101.
- Flynn, J. R. (1987). Massive IQ gains in 14 nations: What IQ tests really measure. Psychological Bulletin, 101(2), 171-191.
- Pietschnig, J., & Voracek, M. (2015). One century of global IQ gains: A formal meta-analysis of the Flynn effect (1909-2013). Perspectives on Psychological Science, 10(3), 282-306.
- Bratsberg, B., & Rogeberg, O. (2018). Flynn effect and its reversal are both environmentally caused. PNAS, 115(26), 6674-6678.
- Ritchie, S. J., & Tucker-Drob, E. M. (2018). How much does education improve intelligence? A meta-analysis. Psychological Science, 29(8), 1358-1369.
- Sackett, P. R., Zhang, C., Berry, C. M., & Lievens, F. (2022). Revisiting meta-analytic estimates of validity in personnel selection. Journal of Applied Psychology, 107(11), 2040-2068.
- Gardner, H. (1983). Frames of Mind: The Theory of Multiple Intelligences. Basic Books.
- Wechsler, D. (2008). Wechsler Adult Intelligence Scale, Fourth Edition: Technical and interpretive manual. Pearson.
Ready for the real thing?
32 puzzles, 25 minutes, your score and its range straight away.
Start the free test